Home
» Knowledge
»
How to Use Crypto Screeners and Scanners to Spot Breakouts Without Chasing Every Pump
How to Use Crypto Screeners and Scanners to Spot Breakouts Without Chasing Every Pump
A crypto screener can show you what is moving. A scanner can show you whether that movement has enough market structure, liquidity, and on-chain context to deserve a closer look. Neither one can tell you with certainty that a breakout will continue.
This guide uses a clearly hypothetical token called NOVA as an illustrative example. NOVA is not a recommendation, and the prices, volumes, holder counts, liquidity figures, and chart patterns shown in the example are fictional. The goal is to demonstrate a repeatable process you can apply to real assets with current data.
The basic idea: screen first, verify second, confirm last
A breakout workflow works best when each tool has a narrow job. Use a screener to reduce thousands of assets to a manageable list. Use market and on-chain scanners to remove names with weak liquidity or suspicious structure. Then use a chart to decide whether price has actually broken a level that matters.
TradingView's current Crypto Coins Screener supports filters across coin information, market data, valuation, holders, transactions, sentiment, and technical indicators. Its technical filters include indicators such as RSI, moving averages, momentum, and Keltner Channels. See the official TradingView Crypto Coins Screener documentation.
CoinGecko can also help narrow the market by category, chain, market cap, 24-hour volume, and 24-hour price change. Its category pages are useful when you want to see whether an individual token is moving with a broader sector rather than in isolation. See CoinGecko's official category guide.
Step 1: Build a breakout candidate list with a screener
Start broad. You are not trying to predict the next winner; you are trying to find assets that have enough activity to justify analysis.
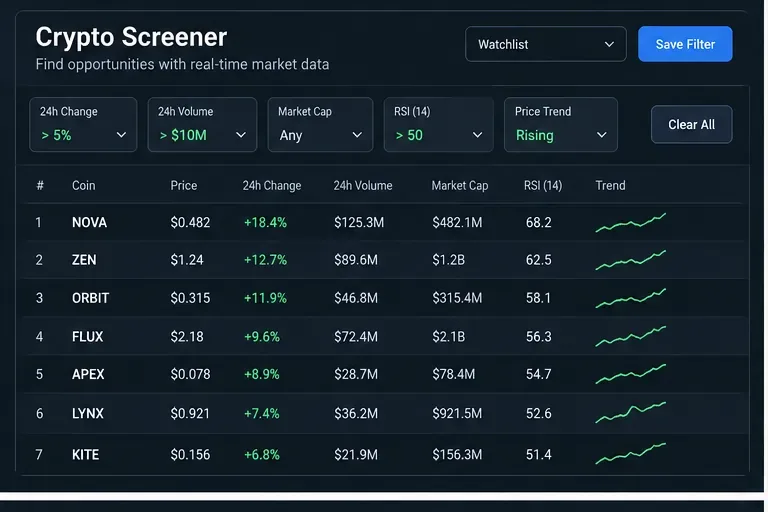
For the fictional NOVA example, imagine that your initial screen asks for coins with positive 24-hour performance, meaningful 24-hour volume, and a rising short-term trend. You might also add a technical condition such as price above a moving average or RSI above the midpoint. Exact thresholds should depend on the market you trade and the asset's normal behavior.
An illustrative screener narrows the market to a short candidate list. The numbers are fictional; in real use, choose filters that match your liquidity requirements and trading horizon.
Volume matters because a large percentage move in a thin market can be easier to distort and harder to trade. CoinMarketCap notes that market activity should be read together with liquidity and confidence rather than treating raw reported volume as the complete picture. Its market-pair ranking considers reported volume alongside liquidity-related measures, and its DexScan surfaces metrics such as liquidity, market age, transaction count, volume, price, and price change. See CoinMarketCap's official feature overview.
A practical first-pass filter
Filter
What it helps answer
Why it matters
24h price change
Is the asset already gaining relative attention?
Useful for finding momentum, but a high number alone can mean you are late.
24h volume
Is enough trading activity present?
Low activity can produce noisy or easily distorted moves.
Market cap or FDV
What size of asset are you dealing with?
Smaller assets often move faster but can carry more liquidity and execution risk.
RSI / trend filters
Is momentum improving?
Helps reduce names that are rising only on a single isolated print.
Category or chain
Is the move part of a broader theme?
Sector participation can provide context for relative strength.
Do not stack so many filters that only one coin can pass. A useful screener produces a shortlist, not a verdict.
Step 2: Scan liquidity and on-chain conditions before studying the chart
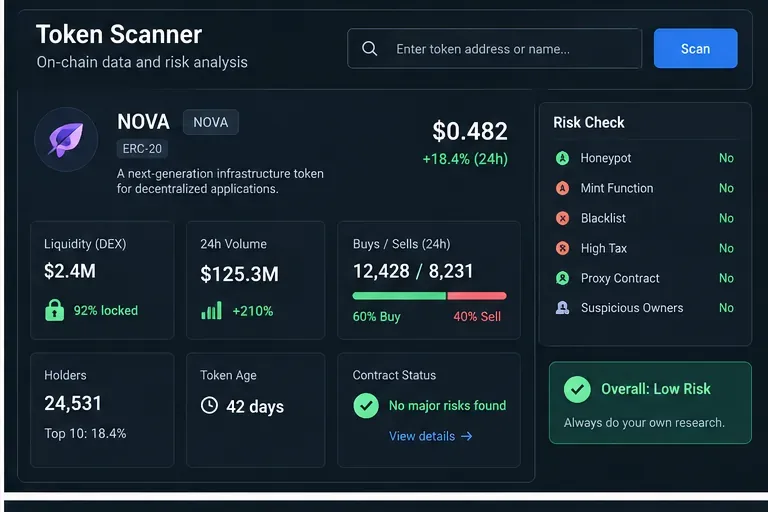
Suppose fictional NOVA survives the first screen. The next question is whether the market behind the price move looks tradeable.
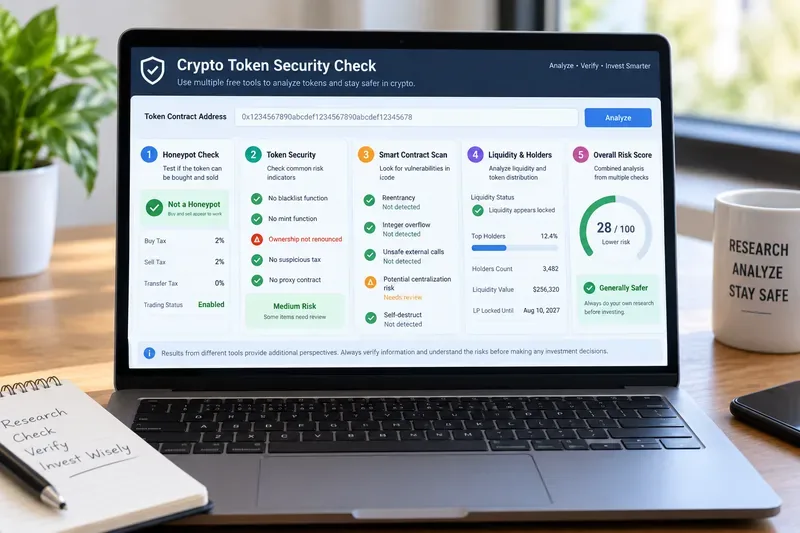
For decentralized markets, examine liquidity, pool age, trading volume, buys versus sells, recent transaction count, and—where available—holder concentration or contract-risk information. These metrics answer a different question from the chart: can you reasonably trust the market structure enough to spend time on a setup?
A scanner adds context the price chart cannot provide. Treat any automated risk label as a screening signal, not proof that a token is safe.
CoinMarketCap's DexScan documentation describes decentralized-market views that include liquidity, fully diluted valuation, market age, 24-hour transactions, volume, USD price, and price change. Those are useful because a breakout with expanding volume but only a tiny liquidity pool can behave very differently from the same pattern in a deeper market.
For centralized-market assets, check whether activity is concentrated on one weak venue or distributed across credible markets. For DEX assets, confirm that you are viewing the correct contract and pool. Tokens can share names and tickers, so the contract address matters more than the display name.
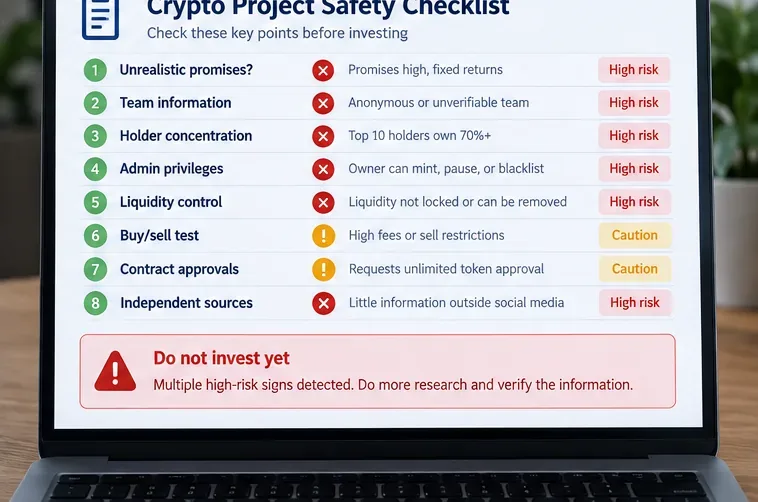
Red flags that should slow you down
Very high percentage gains with little absolute liquidity.
Volume that appears large but is concentrated in a single obscure market.
A newly created pool with almost no trading history.
Extreme holder concentration that could make price sensitive to one wallet.
Contract warnings that you do not understand.
A buy/sell imbalance that looks dramatic but comes from very few transactions.
None of these proves a scam or guarantees failure. They are reasons to do more work before treating a price move as a clean breakout candidate.
Step 3: Mark the level before the breakout happens
Now move to the chart. The key mistake to avoid is drawing a resistance line only after price has already surged far above it. A breakout level is more useful when it was visible before the move.
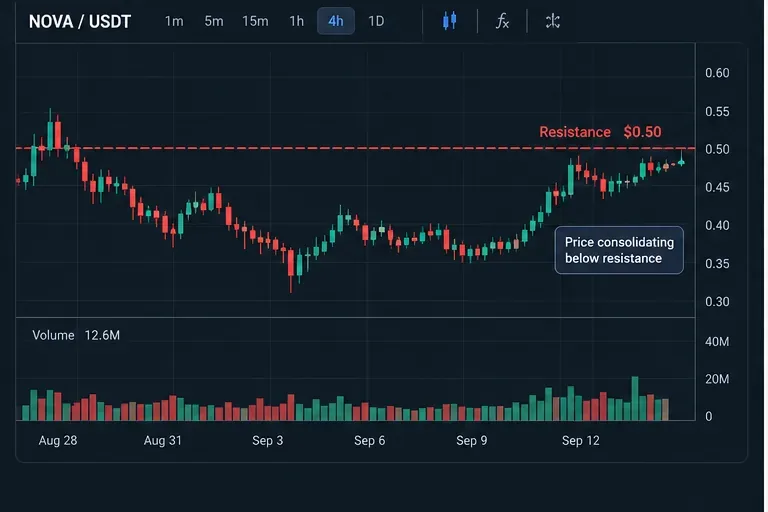
In the fictional NOVA example, imagine price has repeatedly stalled near $0.50 while volume remains moderate. That gives you a reference level. You can now define what would count as a breakout before the excitement begins.
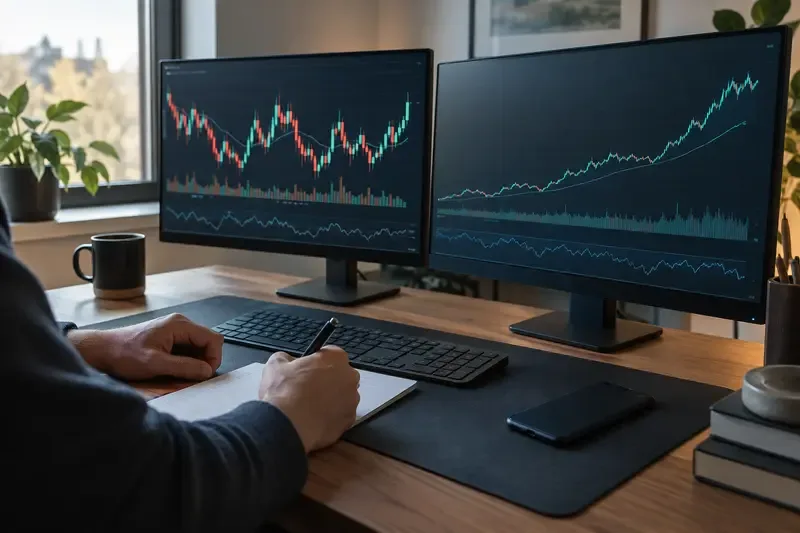
The hypothetical NOVA setup has not broken out yet. The value of the chart is that resistance is identified in advance rather than retrofitted after the move.
A useful breakout level often has one or more of these characteristics: multiple prior reactions, a visible range high, a previous swing high, or a boundary respected across several candles. The more obvious the level, the easier it is to define what a real break—and a failed break—would look like.
Timeframe matters. A five-minute breakout may be irrelevant to someone trading a daily swing. Match your screener refresh rate, technical filters, and chart timeframe to the holding period you actually intend to use.
Step 4: Demand confirmation instead of buying the first green candle
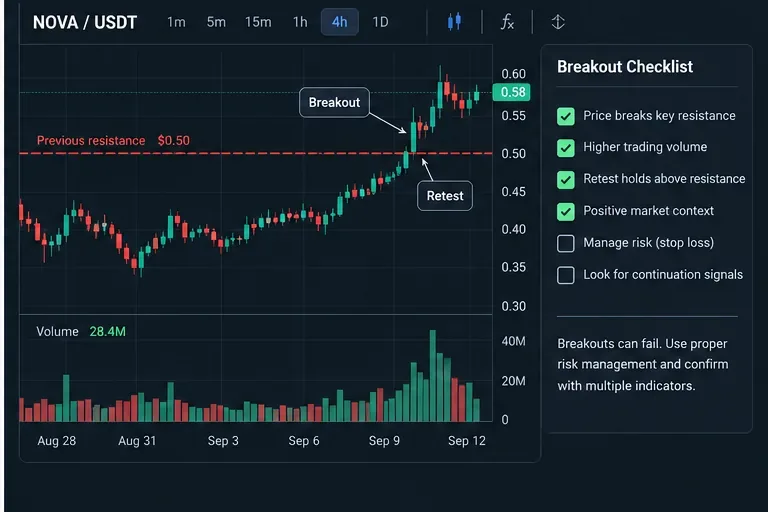
Assume fictional NOVA trades above $0.50. That is not enough by itself. A cleaner confirmation may include a close above resistance, higher-than-usual volume, sustained trading above the level, or a retest that holds.
In the illustrative example, price closes above the prior level and later retests it. This is a teaching example, not evidence from a live market or a tested trading result.
Volume confirmation is especially useful when compared with the asset's own recent baseline. A fixed rule such as “volume must exceed $10 million” says little across assets of very different sizes. Relative volume—today versus the token's normal activity—often gives better context.
TradingView allows technical filters to be customized and saved as screens, while CoinGecko category views can show whether the surrounding sector is also strengthening. That combination helps separate an isolated spike from a move occurring inside a broader momentum environment.
How to avoid false breakouts
No scanner eliminates false breakouts. The practical goal is to make them easier to recognize and cheaper to be wrong about.
A false breakout often has weak follow-through: price briefly trades above resistance, volume fades, and candles close back inside the old range. Another warning is a breakout that occurs while liquidity is deteriorating or while the rest of the relevant market is moving sharply the other way.
Before entering, decide what would invalidate the setup. That could be a close back below the former resistance, a failed retest, or loss of a nearby swing level. The exact rule depends on your strategy, but defining it before entry is more useful than improvising after price reverses.
A repeatable screener-to-breakout workflow
Define your universe. Choose CEX coins, DEX tokens, one chain, one sector, or a market-cap range.
Apply activity filters. Use price change, volume, trend, and technical conditions to create a shortlist.
Check market quality. Review liquidity, venue quality, transaction activity, and pool or token age where relevant.
Verify the asset. Confirm the correct ticker, contract address, chain, and trading pair.
Mark resistance before entry. Use a timeframe aligned with your intended trade.
Wait for confirmation. Look for a close above the level, volume expansion, or a successful retest rather than assuming every intraday spike is a breakout.
Define invalidation and size risk. A valid-looking setup can still fail.
What screeners and scanners cannot tell you
Screeners are excellent at ranking and filtering observable data. They cannot know whether a future catalyst will appear, whether a large holder is about to sell, whether liquidity will disappear, or whether a breakout will continue after you enter.
Scanner outputs also depend on data quality and definitions. CoinMarketCap explicitly distinguishes reported volume from other measures and uses liquidity and confidence context because raw volume can be misleading. CoinGecko likewise notes that market cap is only one factor and provides multiple dimensions such as price, volume, categories, and on-chain metrics. See CoinGecko's market-data overview.
Final breakout checklist
The asset passed a liquidity and activity screen, not just a percentage-gainer list.
The contract, chain, and trading pair are verified.
The breakout level was identified before the move.
Volume is expanding relative to the asset's recent baseline.
Liquidity is sufficient for the position size you are considering.
The move is not contradicted by an obvious scanner warning you have not investigated.
You know what price action would invalidate the setup.
You are treating the screener as a discovery tool, not a buy signal.
The main advantage of combining screeners and scanners is not that they predict breakouts. It is that they create a disciplined funnel: thousands of tokens become dozens of candidates, dozens become a few liquid and structurally acceptable setups, and only then do you ask whether price has actually broken a meaningful level. That process can reduce noise and FOMO, but it cannot remove market risk.