Home
» Knowledge
»
How to Read Crypto Candlestick Patterns for Beginners: A Practical Guide
How to Read Crypto Candlestick Patterns for Beginners: A Practical Guide
What you should be able to do after reading this
A candlestick chart becomes useful when you can move beyond naming shapes and explain what happened during each period, what the surrounding price action says, and what evidence would make you trust or reject a setup. For a beginner, a good result is not “predicting the next candle.” It is being able to read price information consistently, recognize when a pattern has context, and know when the evidence is too weak to act on.
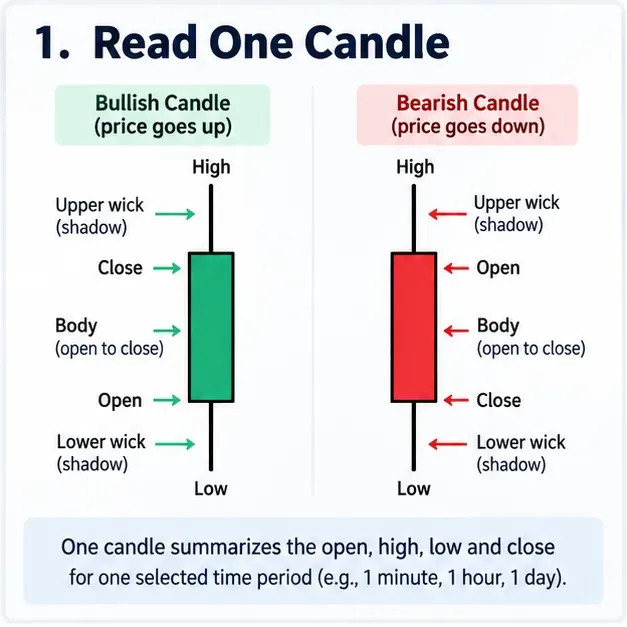
Candlestick charts encode four prices for each selected period: open, high, low, and close. CME Group describes candlesticks as another visual form of OHLC data, with the body showing the distance between open and close and the wick showing the period’s high and low. The timeframe can be minutes, hours, days, or longer. You can review the underlying chart concepts in CME Group’s candlestick chart lesson.
Step 1: Read one candle before you read a pattern
Start with one candle. On most charting platforms, a candle is commonly shown in green when the close is above the open and red when the close is below the open, although colors can be customized. What matters is the relationship among the four prices, not the color itself.
A single candlestick summarizes the open, high, low, and close for one selected time period.
Read the candle in this order:
Open: where the period began.
Close: where the period ended.
High and low: the furthest prices reached during the period.
Body: the distance between open and close.
Wicks or shadows: movement beyond the body before the period closed.
If you cannot identify those five elements quickly, do not rush into pattern names. Pattern recognition is built on accurate candle reading.
Step 2: Use body and wick size to describe pressure, not certainty
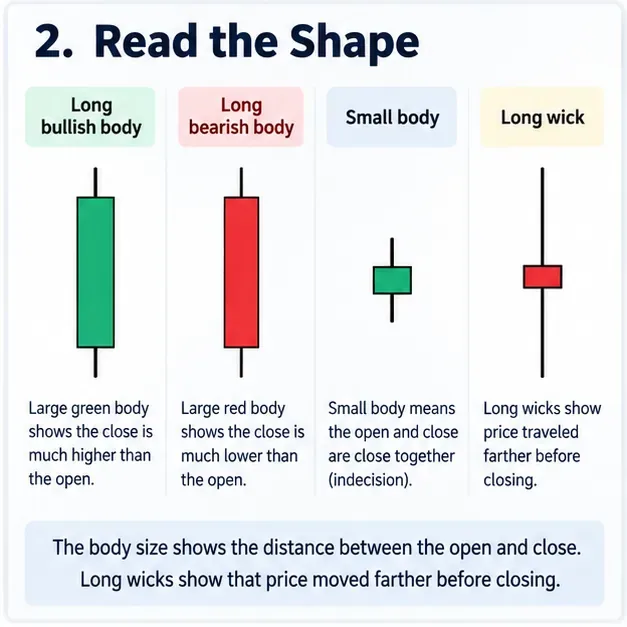
The next skill is to describe what the candle’s shape suggests about the period. CME Group notes that a longer body means the market moved farther between the open and close, while longer wicks show a wider traded range beyond the body. That can help you describe buying pressure, selling pressure, hesitation, or rejection during that period, but it does not prove what the next period will do.
Body size and wick length help describe what happened inside a candle, but they are clues rather than forecasts.
A long bullish body means the close finished well above the open. A long bearish body means the opposite. A small body means the open and close were near each other, which may reflect balance or indecision. A long wick means price traveled farther before returning toward the body by the close.
Quality check: after looking at a candle, you should be able to describe it in plain language without using a pattern name. For example: “Price moved sharply higher, pulled back from the high, and still closed above the open.” That is more useful than simply saying “green candle.”
Step 3: Add pattern context
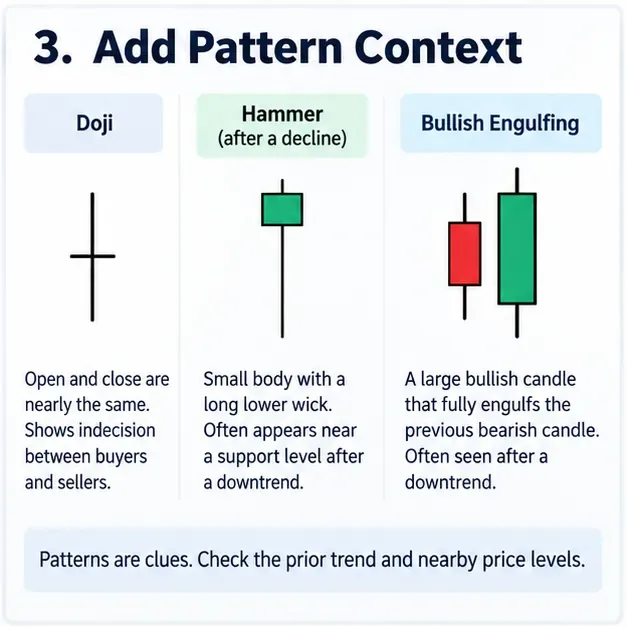
Patterns become more meaningful only after you ask what happened before them and where they formed. A hammer-like candle after a decline is interpreted differently from a similar candle appearing in the middle of a sideways range. A bullish engulfing sequence near a previously observed support area may attract more attention than the same two-candle shape in a random location.
Common patterns such as doji, hammer, and bullish engulfing need the prior trend and nearby price levels to be interpreted sensibly.
Doji
A doji has an open and close that are equal or very close. It is often read as a sign of indecision because neither side created much net movement from open to close. A doji by itself is not a reversal signal. Its relevance depends on where it appears and what follows.
Hammer
A hammer has a small body and a long lower wick. Traders often pay attention to it after a decline because it shows that price traded lower during the period but recovered before the close. The stronger interpretation comes from context: prior decline, nearby support, and what later candles do.
Bullish engulfing
A bullish engulfing pattern uses two candles, with a larger bullish real body covering the prior bearish real body. It can suggest a shift in short-term pressure, but the pattern should not be treated as an automatic buy signal. The trend, location, and follow-through matter.
This is also where beginners should resist memorizing dozens of names. It is better to read three patterns well than to recognize twenty patterns without understanding context.
Step 4: Confirm the setup and define risk before acting
Candlestick analysis improves when you combine the pattern with other information instead of relying on a single shape. Charles Schwab’s educational material on chart reading emphasizes trend, support and resistance, volume, and multiple indicators as contextual tools, while also warning that past performance does not guarantee future results. See Schwab’s chart-reading overview.
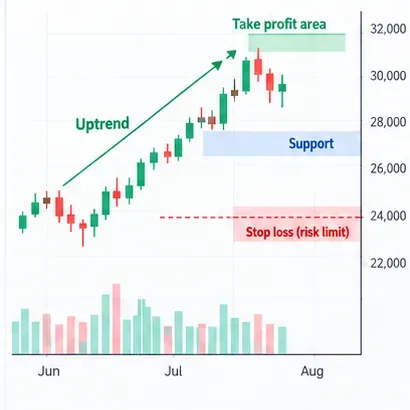
Confirmation means checking the broader trend, nearby levels, follow-through, and a predefined risk limit rather than acting on one candle alone.
Before you act on a candlestick setup, check four things:
Trend: Is price generally making higher highs and higher lows, lower highs and lower lows, or moving sideways?
Location: Is the pattern near an area where price previously reacted, such as support or resistance?
Follow-through: Does the next candle or sequence support the idea, or immediately contradict it?
Risk: Where is the setup invalidated, and how much can you afford to lose if you are wrong?
Volume can add context, but it should not be treated as a magic confirmation tool. The same is true for moving averages, momentum indicators, or trend lines. Too many indicators can create conflicting signals, while too few may leave you reacting to noise. The goal is a repeatable process, not a crowded chart.
How to judge whether your candlestick reading is improving
You are improving when your analysis becomes more specific and less dependent on hindsight. A useful beginner checklist is:
Skill
Weak reading
Better reading
Candle anatomy
“It is green.”
“The close is above the open, the body is large, and the upper wick is short.”
Pattern
“That is a hammer, so price will rise.”
“The hammer formed after a decline; I still need context and follow-through.”
Trend
Looks only at one candle
Checks the surrounding swing structure first
Confirmation
Enters immediately on shape recognition
Looks for supporting price action, levels, or volume
Risk
Decides after entering
Defines invalidation and position risk before entering
A second sign of progress is consistency. If two similar charts lead you to completely different explanations because you already know what happened afterward, your process is still vulnerable to hindsight bias. Practice by hiding future candles and writing your interpretation before revealing what happened next.
When to change your approach
Change your process if you notice that you are constantly finding patterns everywhere, entering trades without a clear invalidation point, switching timeframes only to find a signal you like, or changing the meaning of a pattern after price moves against you. Those are signs that the method is becoming subjective rather than disciplined.
Timeframe should match your decision horizon. Fidelity notes that trends can look very different across timeframes and recommends choosing a timeframe that aligns with the strategy being used. See Fidelity’s chart setup guidance. For crypto, which trades continuously, the “open” and “close” are simply the prices at the beginning and end of the selected candle interval rather than a market-wide daily opening and closing bell. Coinbase explains this distinction in its candlestick chart primer.
The limits of candlestick patterns
Candlesticks summarize historical price behavior. They do not know future news, liquidity shocks, exchange outages, liquidations, regulatory announcements, or sudden changes in market positioning. A visually convincing pattern can fail immediately.
That limitation matters especially in crypto markets, where volatility can be extreme. The U.S. Commodity Futures Trading Commission warns that virtual-currency markets can be highly volatile and that leverage can amplify profits and losses. Its customer advisory on virtual-currency trading risks is worth reading before using technical analysis with real money.
Technical analysis is therefore best treated as a structured way to organize price information, not as a guarantee. The most useful beginner habit is to ask, “What evidence would prove my interpretation wrong?” before asking, “How much could I make if I am right?”
A simple practice routine
Pick one liquid crypto pair and one timeframe that matches the kind of decisions you want to study. On historical charts, mark the open, high, low, and close of several candles. Then describe body and wick structure, identify only a few basic patterns, note the prior trend and nearby levels, and record what would confirm or invalidate the idea. Do this without placing a trade at first.
After 20 to 30 examples, review whether your descriptions are consistent. If you find that your explanations depend too heavily on what happened afterward, simplify the method. The objective is not to collect pattern names. It is to build a chart-reading process that is observable, repeatable, and honest about uncertainty.