Home
» Knowledge
»
R-Multiple Trading Journal: How to Compare Strategies with Different Position Sizes
R-Multiple Trading Journal: How to Compare Strategies with Different Position Sizes
A trading journal can make one setup look like a clear winner simply because it used more shares, contracts, or leverage. A $900 profit sounds better than a $180 profit until you notice that the first trade risked $600 and the second risked $60. Comparing dollars alone confuses position size with trade quality. An R-multiple journal puts each outcome beside the risk taken to earn it, so strategies with different position sizes can be compared on a common unit.
That comparison is useful, but it answers a specific question: how much did a trade gain or lose relative to its planned initial risk? It does not, by itself, say which strategy fits your account, produces the highest return on equity, or will keep working. Use R to compare execution and trade outcomes; keep dollar results, account exposure, and drawdown alongside it.
What one R means in a trading journal
R is the initial dollar risk assigned to a trade. For a simple stock position, calculate it as:
For futures, options, forex, or other products, include the contract multiplier, tick value, or other instrument-specific value per price move. The stop should be the stop in the plan before the outcome is known, not a stop moved afterward to make the record look better. CME Group's position-sizing explanation likewise connects the stop distance and the amount a trader is willing to risk with position size.
The trade's R-multiple is its realized profit or loss divided by that initial risk:
R-multiple = net realized P/L ÷ initial risk
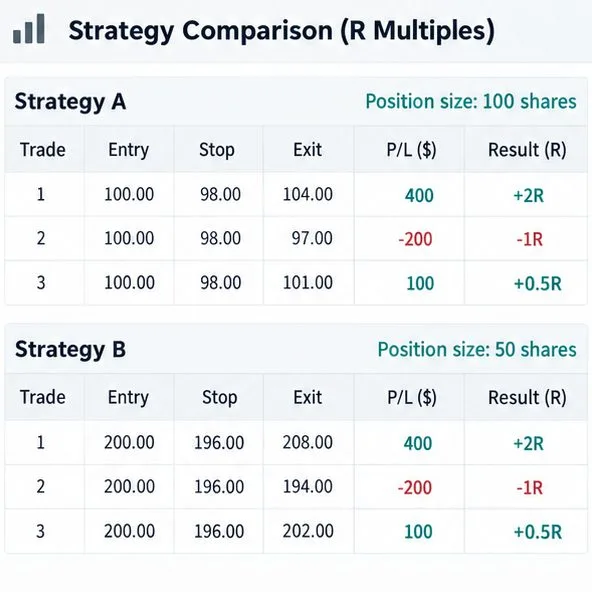
If a position risked $200 and closed with a net $400 gain, the result is +2R. If it lost $200, it is -1R. A second trade might risk $500 and net $1,000; that is also +2R, even though its dollar outcome and size are larger. Van K. Tharp's original explanation defines R-multiples as profits or losses expressed relative to initial risk.
For a consistent journal, choose one cost convention and use it for every strategy. A practical choice is to subtract commissions, exchange fees, borrow or funding costs, and slippage from realized P/L, while keeping the denominator as the pre-trade stop-based risk. Record gross P/L and each cost separately as well. This makes net R comparable and lets you see whether apparent edge is being consumed by execution costs. If costs are included in your 1R denominator instead, label that method and apply it consistently.
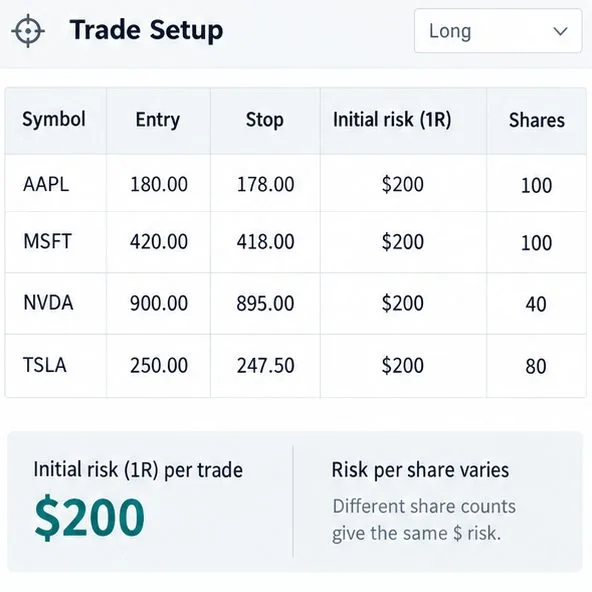
Illustrative setup rows show how share count can change while planned dollar risk stays at $200.
Build the journal in four passes
1. Record the risk before the trade
Start with a row for every entry or planned trade: date and time, strategy name and version, instrument, direction, entry price, initial stop, quantity, contract multiplier, and the resulting 1R in dollars. Also record the market or setup tags you intend to compare, such as session, volatility condition, or entry type. Keep tags objective enough that you can apply them the same way to winners and losers.
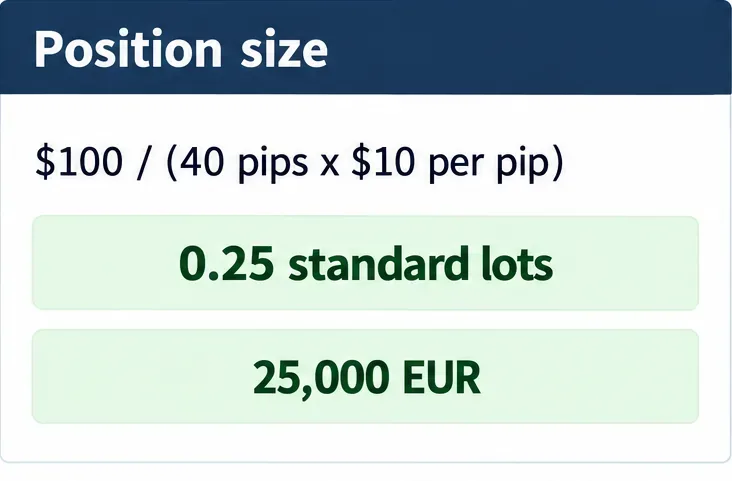
For example, buying 100 shares at $50 with a planned stop at $48 creates $200 of price risk: ($50 - $48) × 100. Buying 40 shares with a $5 stop also creates $200 of risk. The number of shares is not the common denominator; the planned loss at the stop is.
2. Log the exit and actual costs
At close, enter the exit price or prices, quantities sold, gross realized P/L, commissions and fees, slippage, financing or borrow charges when applicable, and net realized P/L. Preserve the original entry-time 1R even if you later trail a stop, scale out, or add to the position. This keeps the record from redefining risk after seeing the outcome.
If a position is built in several planned tranches, decide in advance whether each tranche is a separate trade or whether the entire position is one trade. For a combined trade, the denominator should reflect the total initial risk of the position as actually planned and filled. Log the rule in the journal notes. Do not switch between methods inside one strategy sample.
Partial exits require the same care. Sum the realized profits and losses across all fills, subtract costs, then divide by the initial risk for the whole trade. If some shares remain open, label the result as open or mark-to-market rather than mixing it with completed trades. Record both realized and unrealized values if you review open positions.
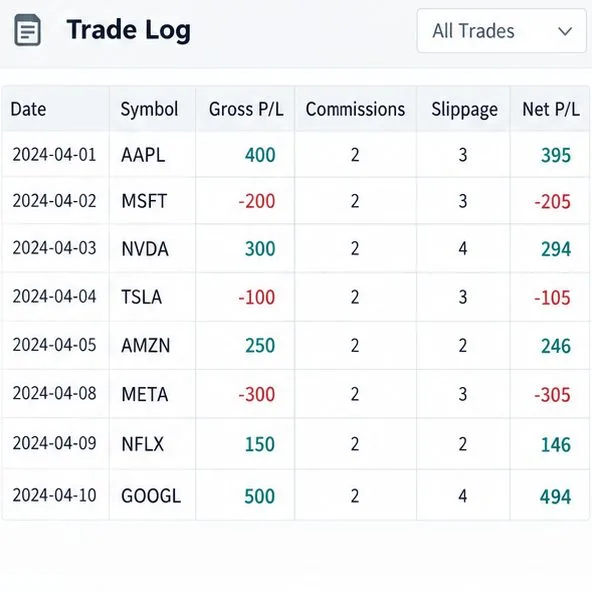
The cost columns make clear why a journal should preserve gross P/L and net P/L separately.
3. Normalize each completed outcome
Add the R-multiple formula to the journal and calculate it for every closed trade. For instance, a trade with a $200 initial risk and $294 net realized profit returns +1.47R; a trade with the same initial risk and a $205 net loss returns -1.025R. Losses can be below -1R when a gap, fast market, execution delay, or costs carry the exit beyond the planned stop. Keep the actual result; do not cap it at -1R.
For simple stock or futures examples, a spreadsheet formula can be expressed as Net P/L / Initial Risk. Confirm that the denominator is positive and nonzero, and that the numerator and denominator use the same currency. If your platform reports P/L in points, convert it to dollars using the position quantity and contract value before dividing.
With equal initial risk conventions, different position sizes can produce matching R outcomes for comparison.
4. Compare the distribution, not just the total
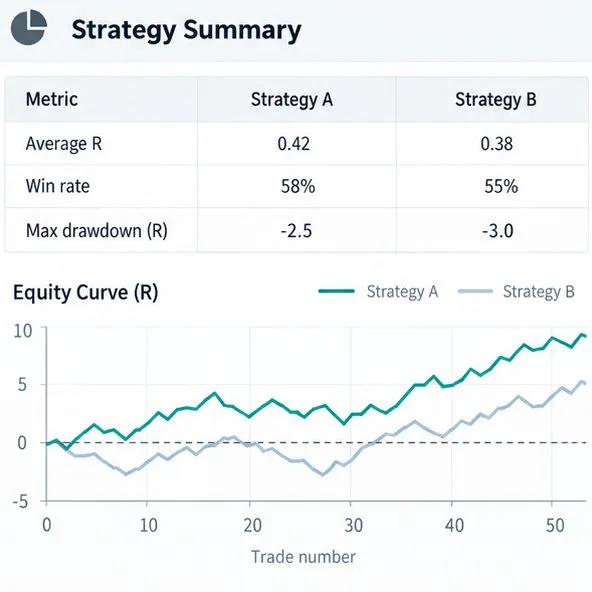
Group rows by a stable strategy label and calculate at least: number of trades, average R (the arithmetic mean of all net R outcomes), median R, win rate, average winning R, average losing R, cumulative R, and maximum drawdown in R. Average R captures both how often a strategy wins and the size of wins and losses; a high win rate alone can hide a small number of outsized losses. Van Tharp describes the mean R-multiple as a strategy's expectancy over the recorded trades.
Use the same date range, instruments, execution assumptions, and trade definition for each strategy. If Strategy A has 250 trades and Strategy B has 18, show the counts prominently; their averages do not have the same evidential weight. Avoid selecting only a favorable month or market regime. Separate in-sample development from later forward or out-of-sample trades when possible, and do not tune tags after looking at which filter wins.
A summary is easier to interpret when expectancy, win rate, drawdown, and the sequence of R results appear together.
What R comparison reveals—and what it leaves out
Suppose two strategies each record +2R on a trade, but one risks $100 and the other risks $1,000. The journal shows the same outcome per unit of planned risk, while the cash results differ by ten times. That is exactly why R helps separate trade outcome from position size. It does not make the trades identical in account impact: the larger-risk trade consumes more capital at risk and may create a larger portfolio loss if several positions move together.
R is not the same as percentage return on account. If you risk a fixed dollar amount, summing R gives a useful normalized sequence. If you risk a changing percentage of equity, a +1R outcome represents different dollars as the account changes; compounding then affects the actual equity curve. Keep a separate account-level curve in dollars or percentage terms, calculated from the real sizing rule, deposits, withdrawals, and costs.
R also cannot erase differences in liquidity, leverage, margin, gap risk, market impact, or correlations between simultaneous positions. A strategy with positive average R may still have an unacceptable losing sequence or drawdown. A strategy comparison should show worst peak-to-trough drawdown in R and in account percentage under the intended sizing rule. Include overlapping exposure if trades can be open together.
Self-check before trusting the comparison
Does every trade retain its original entry-time stop and initial risk?
Are quantities, multipliers, currencies, partial exits, and costs handled consistently?
Can you reconcile net P/L in dollars with R for a few individual rows by hand?
Are all trades included, including skipped, stopped, open, and unusually bad outcomes?
Do the strategies cover comparable instruments, dates, and market conditions, with trade counts shown?
Do you review cumulative R and drawdown as well as average R, win rate, and cash return?
Have you kept backtest results separate from live results and included realistic costs?
If a check fails, fix the journal rule before ranking strategies. If the arithmetic reconciles but samples are small or market conditions differ, treat the comparison as a working observation rather than proof of an edge. The SEC's Investor.gov guidance notes that back-tested performance is hypothetical and that past performance cannot predict future results. R-multiples make the record more comparable; they do not guarantee that a strategy will remain profitable or determine the right position size for your account.