Home
» Knowledge
»
Drawdown Recovery Math: Why a 50% Loss Needs a 100% Gain
Drawdown Recovery Math: Why a 50% Loss Needs a 100% Gain
A 50 percent loss does not call for a 50 percent gain to get back to even. If an investment falls from $100 to $50, it must rise by $50. That $50 increase is 100 percent of the remaining $50, so the recovery return is 100 percent. The arithmetic comes from the smaller base left after the decline.
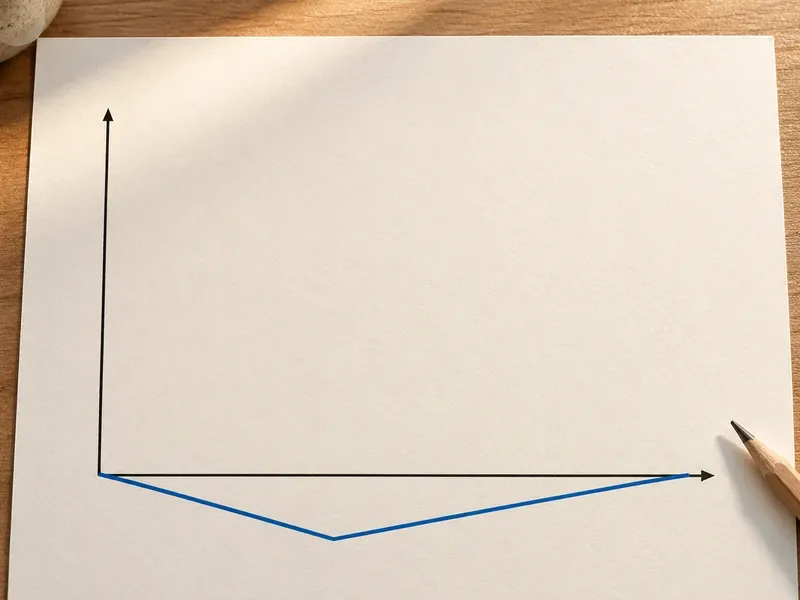
A line returns to its starting level after a decline; the recovery percentage is measured from the lower value at the bottom.
This relationship is useful when reviewing a portfolio, a single holding, or a trading strategy. It also has a limit: recovery math describes the return required to regain a prior value. It does not predict whether, when, or how an investment will recover.
Why does a 50 percent loss require a 100 percent gain?
Percentages use a starting value as their denominator. A 50 percent loss on $100 removes $50, leaving $50. To return to $100, the investment has to add $50 to that remaining $50:
Required recovery gain = (prior value − current value) ÷ current value
In this example: ($100 − $50) ÷ $50 = 1, or a 100 percent gain. The dollar amount lost and the dollar amount needed to recover are the same, but the percentages differ because they are calculated from different bases. FINRA’s explanation of rate of return likewise frames a percentage return as a gain or loss relative to the amount invested; see its return and rate-of-return discussion.
More generally, if a value falls by d as a decimal fraction, the fraction remaining is 1 − d. The gain needed to get back to the original amount is:
Recovery return = d ÷ (1 − d)
For a 50 percent decline, 0.50 ÷ 0.50 = 1, or 100 percent. The formula assumes the comparison starts from the same original value and that no deposits, withdrawals, fees, taxes, or distributions change the account value along the way.
How large is the required gain after different losses?
The recovery percentage rises faster than the loss percentage because each new loss is applied to a smaller remaining balance.
Loss from the prior value
Value remaining
Gain needed to break even
10%
90% of the start
11.1%
20%
80%
25%
30%
70%
42.9%
40%
60%
66.7%
50%
50%
100%
60%
40%
150%
75%
25%
300%
90%
10%
900%
For instance, a 75 percent decline turns $100 into $25. A return of 75 percent on $25 adds only $18.75, leaving the value at $43.75. A 300 percent return adds $75 and restores the $100 starting value. At a total loss, the formula has no finite recovery percentage: zero cannot grow through a percentage return alone. New capital or a separate source of value would be needed.
What “drawdown” means in a portfolio review
A drawdown is a decline from a prior high to a later low. Investors often use “maximum drawdown” for the largest peak-to-trough decline measured over a chosen period. The measurement depends on the period, the valuation frequency, and whether the calculation uses account values that include income and costs. A decline from an all-time high may be described differently from a loss compared with the investor’s original deposit.
That distinction matters because a portfolio can be down from its peak while still being above its purchase cost, or it can be below its purchase cost after recovering from a deeper trough. When you check a report, identify the reference point: peak value, initial investment, or another benchmark. Then check whether the reported return includes dividends and other distributions. FINRA notes that total return combines gain or loss in value with investment earnings, while taxes, commissions, and fees affect the investor’s bottom line.
Why the recovery percentage is not a recovery forecast
The formula is an accounting relationship, not an expected-return estimate. A holding that needs a 100 percent gain after a 50 percent loss may recover, decline further, or never return to its previous price. A larger required return also does not make a rebound more likely. Avoid treating the recovery figure as a target that an asset is obliged to reach.
Time depends on the sequence and size of future returns. As a purely hypothetical illustration, if a $50 balance earned a constant 10 percent per year with all returns reinvested and no fees, taxes, or cash flows, it would take a little over seven years to reach $100. Actual returns vary and are not guaranteed; the assumed rate is only an arithmetic example. The SEC’s Investor.gov describes compounding as earning returns on invested money and on returns already accumulated, but compounding can work in either direction when values fall as well as rise. See its compound returns glossary.
What changes when you add or withdraw money?
Cash flows change the account balance without necessarily representing investment performance. If you add $1,000 after a loss, the account may move closer to its old dollar value, but that contribution is not a market gain. A withdrawal can make the account’s balance smaller even when the remaining investments have not fallen by the same percentage. To assess performance across deposits and withdrawals, use a return method that accounts for cash-flow timing, and compare it with the simple start-to-end balance.
Fees and taxes can also increase the amount needed to restore an after-cost balance. Dividends or interest may offset some price decline when included in total return, while taxes or transaction costs may reduce the net result. Product details matter: a fund’s reported share price, a brokerage account’s total value, and an investor’s after-tax proceeds are different measures. FINRA’s investor education explains that total return includes investment earnings and that costs can affect the bottom line in its rate-of-return guidance.
A practical way to use drawdown recovery math
Choose the value you are measuring. Use the portfolio, position, or strategy value that matches your question.
Set the reference point. Decide whether you are measuring from a previous peak, your purchase value, or another clearly stated starting point.
Calculate the decline. Divide the difference between the reference value and the current value by the reference value.
Calculate the recovery requirement. Divide that same dollar difference by the current value. This gives the percentage gain required to get back to the chosen reference.
Adjust for what the calculation excludes. Consider distributions, deposits, withdrawals, fees, and taxes, and make sure you compare like with like.
As a cross-check, multiply the current value by one plus the required recovery return. If a $100 value falls 50 percent to $50, then $50 × (1 + 1.00) = $100. If the result does not return to the selected starting value, check the denominator: the loss percentage uses the starting value, while the recovery percentage uses the lower current value.
What the math can—and cannot—tell you
Drawdown recovery math is a quick way to see how much a decline changes the hurdle for breaking even. It is especially helpful when comparing a moderate loss with a deep one, or when a percentage chart makes a large decline look deceptively easy to reverse. The result can inform risk discussions, but it cannot identify a suitable investment, set a prudent allocation, or say whether selling or holding is right for a particular person.
Risk controls and diversification may help reduce the chance that one position dominates a portfolio, but they do not guarantee a recovery or prevent losses. FINRA explains that diversification spreads investments across assets and holdings to reduce concentration risk; it does not remove market risk. Review the FINRA overview of asset allocation and diversification for context. The practical takeaway is simple: calculate the required gain from the value that remains, label the reference point, and treat the answer as a break-even threshold—not a promise about future performance.