Home
» News
»
Layer 1 Blockchains vs. Layer 2 Networks: Where Is the Capital Flowing?
Layer 1 Blockchains vs. Layer 2 Networks: Where Is the Capital Flowing?
You may look at a blockchain ranking, see one network gaining TVL, and assume that capital is moving there from another chain. That conclusion is often too quick. A rise in TVL can come from higher token prices, incentive programs, bridged assets, or a small group of applications. Meanwhile, a network with lower TVL may be processing more transactions, attracting more stablecoins, or generating more fees.
The practical answer is that capital is not flowing in one clean direction from Layer 1 blockchains to Layer 2 networks, or the other way around. As of the data checked on September 15, 2026, the strongest visible pattern is concentration: major Layer 1 settlement hubs and a small number of large Layer 2 ecosystems continue to attract most of the measurable liquidity. To identify the direction of travel, you need to compare several signals in the same time window.
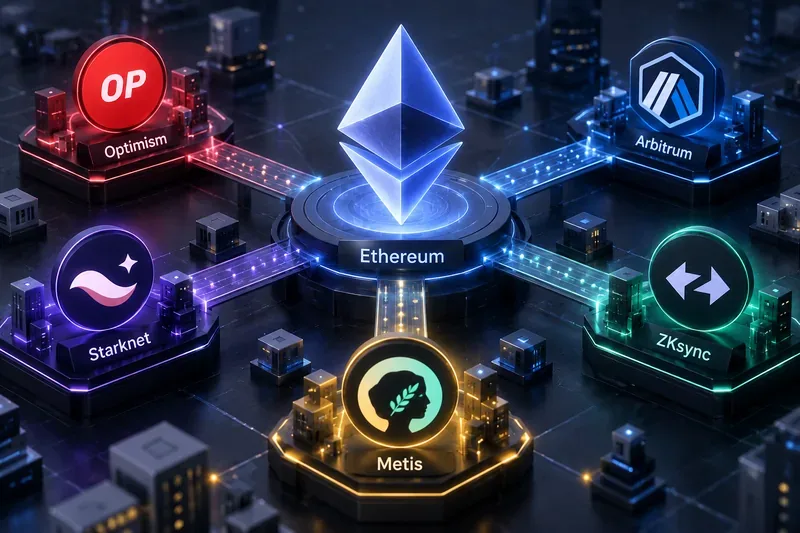
An analyst compares interconnected blockchain networks while assessing where liquidity and activity are concentrating.
Start with the problem: TVL is not the same as capital flow
Total value locked, or TVL, is a snapshot of assets held in protocols at a particular time. It is useful for estimating the scale of a decentralized-finance ecosystem, but it does not directly tell you how much new money entered during the period. If ETH, SOL, or another asset rises in dollar price, TVL can increase even when the number of tokens deposited stays flat. Conversely, a falling token price can reduce TVL without a comparable withdrawal.
TVL can also count the same economic value in more than one place. An asset may be locked on a bridge, deposited in a lending market, and then used as collateral for another position. Depending on the dashboard's methodology, that activity may appear as several related balances. Incentive-driven liquidity can inflate a short-term figure and disappear when rewards decline.
Use TVL to answer the easy question—where is liquidity sitting now? Then use flows, stablecoin supply, trading volume, fees, and user activity to answer the harder question—where is capital being deployed or withdrawn?
What is the difference between a Layer 1 and a Layer 2?
A Layer 1 is a base blockchain that reaches consensus, records transactions, and provides the settlement environment for applications. Ethereum, Solana, BNB Chain, Avalanche, and other independent networks are examples of Layer 1 designs, although their architectures and security models differ.
A Layer 2 is a separate execution environment built to process activity away from a base chain while relying on that base chain for some combination of settlement, data availability, or security. Ethereum's own explanation describes rollups as networks that store data on Ethereum's main network, while networks that store data elsewhere are not direct Ethereum extensions. Not every project calling itself an L2 has the same technical guarantees, so the label should not replace a risk review.
This distinction matters for capital analysis. Money can be economically connected to Ethereum while users transact on Base, Arbitrum, OP Mainnet, or another network. A transfer to an L2 is not automatically a vote against Ethereum. It may be a way to use Ethereum-linked liquidity at lower cost or with a different application experience.
What the current data says—and what it does not say
The dashboards checked for this article show why different measurements must be kept separate. DeFiLlama's chain table listed approximately $49.27 billion in DeFi TVL for Ethereum, $5.80 billion for Solana, $5.54 billion for Base, and $1.38 billion for Arbitrum at the time of checking. These figures describe DeFi TVL under DeFiLlama's methodology, not net capital inflows.
L2BEAT's Layer 2 summary used a different measure called total value secured. Its table listed about $14.38 billion for Base, $10.75 billion for Arbitrum One, and $1.64 billion for OP Mainnet. The difference between those numbers and DeFiLlama's DeFi TVL is not necessarily an error. The dashboards cover different assets, contracts, bridges, and definitions. Comparing them as if they were identical accounting systems can create a false conclusion.
Metric
What it helps answer
Main limitation
DeFi TVL
Where assets are deposited in tracked protocols
Price changes and methodology can dominate the result
Total value secured
How much value an L2 ecosystem reports as secured or associated with it
It is not directly comparable with every TVL dashboard
Stablecoin supply and net inflows
Where dollar-like liquidity is arriving or leaving
Stablecoins can sit idle and do not prove productive demand
DEX volume and fees
Where trading and economic activity are occurring
Volume may be wash trading, incentives, or short-lived speculation
Where capital appears to be concentrating
1. Core Layer 1 settlement and liquidity hubs
Ethereum remains important because it combines a large base of applications, stablecoins, staking, and settlement activity. Its Layer 2 ecosystem does not make Ethereum irrelevant; it can extend the reach of Ethereum-linked capital. Solana, meanwhile, remains a distinct Layer 1 liquidity center with its own applications, users, and native asset economy. The relevant comparison is not simply Ethereum versus Solana TVL. It is whether users and capital are finding better execution, deeper markets, stronger applications, or lower risk on one environment than another.
2. A few large Layer 2 application hubs
Within Ethereum scaling, the current L2BEAT snapshot places Base and Arbitrum One well ahead of several other listed rollups by total value secured. That concentration suggests that liquidity is not being distributed evenly across every L2. Users tend to favor networks with recognizable applications, reliable bridges, deep stablecoin markets, wallet support, and enough volume to reduce slippage.
However, a large L2 balance does not guarantee a strong investment case. A network can attract capital through grants, points, token incentives, or temporary yield. The quality of the capital matters: sticky stablecoin liquidity and recurring application revenue are generally more informative than mercenary liquidity that leaves when rewards fall.
3. Stablecoin rails rather than native-token speculation
Stablecoins are often the first layer of deployable liquidity. They can move between chains quickly, sit in lending markets, provide DEX liquidity, or remain unused in wallets. A network that gains stablecoin supply while also gaining organic volume and fees may be attracting usable capital. A network that gains stablecoins but shows little lending, trading, payments, or fee activity may simply be serving as a temporary parking place.
A simple-to-advanced way to trace the flow
Step 1: Establish a comparable starting point
Choose the same metric, date, and time window for every network. Compare 7-day and 30-day changes instead of mixing a daily L1 figure with a monthly L2 figure. Record whether the dashboard is showing DeFi TVL, bridged TVL, total value secured, or another measure.
Step 2: Adjust for token-price effects
Check whether TVL changed because deposited token balances increased or because the tokens became more valuable in dollars. If possible, compare native-token amounts and stablecoin balances separately. A dollar increase without more units is weaker evidence of fresh capital.
Step 3: Follow stablecoins and bridges
Look for net stablecoin inflows, not only total supply. Then inspect bridge flows and the destination contracts. A bridge inflow can be sent straight back out, moved into a protocol, or left idle. The destination tells you whether capital is being used.
Step 4: Confirm economic activity
Compare DEX volume, active addresses, transaction or operation counts, lending utilization, fees, and application revenue. Activity should be evaluated over several weeks. One unusually busy day may reflect a launch, a points campaign, or automated transactions rather than durable adoption.
Step 5: Review the risk and incentive layer
For an L2, inspect the proof system, data-availability approach, upgrade controls, sequencer design, withdrawal assumptions, and current maturity stage. L2BEAT provides a useful starting point for this research, but a ranking is not a safety certification. Ethereum.org also notes that L2 safety depends on technology, smart-contract security, and network maturity.
How to interpret common signals
TVL up, stablecoins flat, token price up: the move may be mostly valuation rather than new liquidity.
Stablecoins up, volume and fees up: this is stronger evidence that usable capital and demand are arriving together.
TVL up, volume flat, incentives high: treat the increase as potentially temporary until activity survives a reward reduction.
Bridge inflows up, protocol deposits flat: capital may be arriving but waiting in wallets or moving to another destination.
Transactions up, fees and revenue weak: activity may be cheap, automated, subsidized, or not yet valuable to the ecosystem.
Native token price up while stablecoin liquidity falls: market capitalization is strengthening, but deployable on-chain liquidity may be weakening.
What can change the conclusion?
Capital flows can reverse quickly after a bridge incident, smart-contract exploit, token unlock, liquidity-mining change, exchange listing, or shift in risk appetite. A new application can also pull liquidity from an established chain without representing a lasting migration. In addition, cross-chain aggregators and centralized exchanges can obscure the final destination of funds.
For that reason, avoid treating one dashboard, one token price, or one ranking as a complete market thesis. The safest conclusion is usually conditional: capital appears to be concentrating in a network when its liquidity, stablecoins, activity, and fees improve together, while competing networks weaken on the same measures.
Self-check: can you support your capital-flow conclusion?
Before deciding that money is moving toward a Layer 1 or Layer 2, write down the answer to these questions:
Did the conclusion use the same metric and time window for every network?
Did you separate token-price appreciation from growth in deposited units?
Did stablecoin supply and net bridge flows confirm the TVL direction?
Did trading volume, fees, revenue, or lending utilization improve as well?
Could incentives, duplicated collateral, or automated activity explain the increase?
Did you review the network's security assumptions and maturity before treating the flow as investable?
If several answers are no, describe the result as a TVL trend rather than a confirmed capital flow. If most answers are yes across multiple weeks, the evidence is more useful—but it still describes changing market conditions, not a guaranteed price outcome or a recommendation to buy a particular asset.
Sources and data note
This article was checked on September 15, 2026. Definitions and ecosystem context were reviewed using Ethereum's Layer 2 overview. The L2 comparison snapshot came from L2BEAT's Layer 2 summary. Chain TVL, stablecoin, and activity comparisons were checked against DeFiLlama's chain rankings and its stablecoin dashboard. These dashboards update continuously; figures may be different when the article is read.