Home
» News
»
Golden Cross vs. Death Cross in Crypto: How Moving Average Crossovers Really Work
Golden Cross vs. Death Cross in Crypto: How Moving Average Crossovers Really Work
A golden cross and a death cross are two versions of the same idea: compare a faster moving average with a slower one and watch for the moment their order changes. The signal is simple, but the trade-off is not. Longer averages can filter noise but react late. Faster averages respond sooner but can produce more false signals. In crypto, where volatility can be extreme and markets trade continuously, that choice matters.
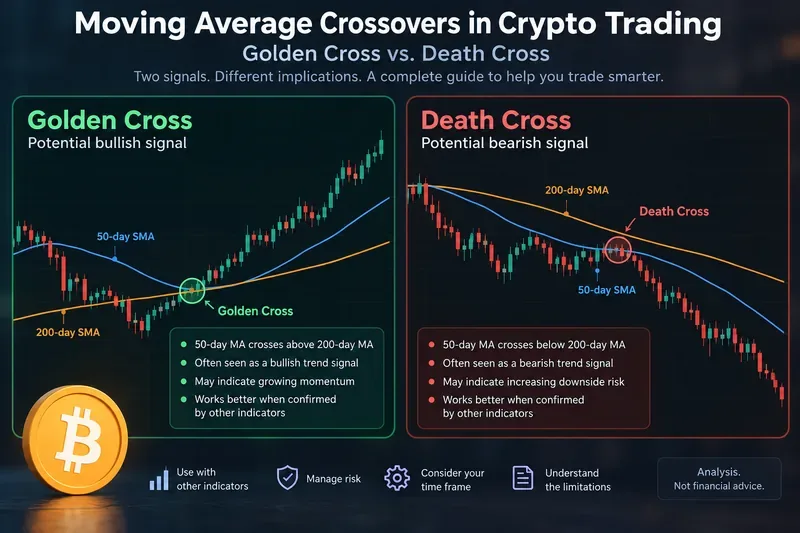
The classic convention uses a 50-period moving average and a 200-period moving average. A golden cross occurs when the shorter average rises above the longer one; a death cross occurs when it falls below. CME Group describes moving-average crossovers in the same directional terms: a shorter-term average crossing above a longer-term average is generally interpreted as bullish, while a cross below is generally interpreted as bearish. See CME Group’s moving-average education.
A golden cross and a death cross use the same crossover logic in opposite directions. The illustration is conceptual; real crypto charts can produce cleaner, messier, earlier, or later signals.
What is a moving average actually doing?
A moving average smooths a sequence of historical prices. It does not know what will happen next. TradingView’s indicator documentation explicitly describes moving averages as lagging, reactive indicators used to interpret and confirm trends rather than as predictive tools. Its moving-average documentation also notes that shorter lookback periods stay closer to price, while longer periods react more slowly.
This leads to the central trade-off behind every crossover system:
Shorter averages: faster response, earlier entries and exits, but more noise and more whipsaws.
Longer averages: smoother trend confirmation and fewer signals, but greater delay after a reversal has already begun.
The golden cross and death cross are therefore not separate indicators. They are labels for opposite outcomes of the same trend-following mechanism.
Golden cross vs. death cross: what changes for the trader?
Criterion
Golden cross
Death cross
Definition
Fast MA crosses above slow MA
Fast MA crosses below slow MA
Typical interpretation
Trend structure has turned more bullish
Trend structure has turned more bearish
Main strength
Helps confirm sustained upside momentum
Helps confirm sustained downside momentum
Main weakness
Can appear after a large portion of the rally has already occurred
Can appear after a large portion of the decline has already occurred
Most useful environment
Persistent uptrends after a base or recovery
Persistent downtrends after distribution or breakdown
Worst environment
Sideways, choppy markets where the averages repeatedly cross back and forth
Neither signal is inherently stronger. Their usefulness depends on whether your goal is trend confirmation, position management, tactical entry timing, or risk reduction.
Should you use SMA or EMA for crossover signals?
This is one of the most practical choices. A simple moving average, or SMA, gives equal weight to each observation in its lookback window. TradingView’s SMA documentation describes it as an unweighted average. The result is relatively smooth but slower to incorporate a sharp change in recent prices.
An exponential moving average, or EMA, gives more weight to recent data. TradingView’s EMA documentation explains that this weighting makes the EMA react faster than a comparable SMA.
If your priority is...
More suitable choice
Trade-off
Fewer, slower trend signals
SMA pair
More lag
Faster reaction to changing momentum
EMA pair
More sensitivity to short-lived price swings
Long-term portfolio trend filter
50/200 SMA is a common convention
Very late on fast reversals
Active swing trading
Shorter EMA combinations may respond sooner
Higher risk of repeated false crosses
The important point is consistency. If you backtest a 50/200 SMA system, switching to EMA after a bad signal changes the system. A useful process defines the average type, price source, timeframe, and execution rule before evaluating the result.
Why the 50-day and 200-day averages are popular—but not magical
The 50/200 combination is widely watched because it separates a medium-term trend measure from a much slower long-term measure. TradingView notes that 50- and 200-day moving averages are commonly used for long-term analysis. That popularity can make the levels behaviorally relevant because many market participants see the same configuration.
But there is no mathematical law that makes 50 and 200 optimal for Bitcoin, Ether, or every altcoin. A token with a short trading history may not even have enough data for a meaningful 200-day average. A thinly traded asset can also produce erratic candles that distort a crossover system.
For long-horizon investors who want a slow regime filter, 50/200 can be reasonable to study. For shorter swing trades, a faster pair may better match the holding period. The cost is that faster systems generally react to more noise.
Where crossover systems tend to work better
Moving-average crossovers are trend-following tools. They are most naturally suited to markets that move far enough in one direction for the trend to compensate for late entry and late exit.
A persistent crypto bull market can allow a golden-cross system to remain aligned with the trend for months. A prolonged bear market can allow a death-cross filter to keep a trader out of repeated downside. In those conditions, the fact that the signal is late may be acceptable because the trend continues after the crossover.
There is historical academic evidence that simple moving-average rules can contain information in some markets. A widely cited 1992 Journal of Finance study by William Brock, Josef Lakonishok, and Blake LeBaron tested moving-average and trading-range rules on the Dow Jones Industrial Average from 1897 to 1986 and reported statistically meaningful differences following buy and sell signals. The original paper is available through The Journal of Finance.
That study is useful as evidence that trend rules deserve empirical testing, but it is not proof that a particular crypto crossover remains profitable today. It examined a historical U.S. stock index, not 24/7 digital-asset markets, and trading costs, market structure, and competition have changed materially.
Where golden crosses and death crosses struggle
Sideways markets create whipsaws
Imagine Bitcoin trading inside a wide range for several months. The 50-day average moves above the 200-day average, then price reverses. Weeks later the fast average crosses back below. Neither side develops into a sustained trend. A mechanical trader can buy late, sell late, and repeat the process.
This is the classic weakness of a trend-following crossover: it needs directional persistence. When price mean-reverts around the averages, the system can lose repeatedly in small increments.
Fast crypto crashes expose the lag
A death cross can occur well after a sharp decline begins. That is not a malfunction; it is a direct consequence of averaging historical data. The longer the lookback, the slower the confirmation.
The opposite is true after a violent rebound. A golden cross may occur after price has already recovered substantially. Traders who interpret the crossover as a precise entry point can therefore end up chasing an extended move.
Low-liquidity tokens can distort the signal
Large gaps, irregular volume, exchange-specific prints, and short market histories can make moving averages less stable. Before using a crossover on a small-cap token, check whether the chart has sufficient history and whether the trading venue has enough liquidity for realistic execution.
Should you enter immediately when the lines cross?
That depends on the objective. An immediate close-based entry is simple and easy to test, but it gives the signal no confirmation. Waiting for additional evidence can reduce some false entries, but it can also make an already lagging system even later.
Three common approaches illustrate the trade-off:
Immediate crossover entry: simplest rules and earliest participation, but most exposed to false crosses.
Wait for a daily close after the cross: filters intraday movement, but enters later.
Require confirmation from price structure or another metric: potentially more selective, but introduces more variables and more opportunities for overfitting.
There is no universal confirmation rule. A trader who values repeatability may prefer a simple close-based system. A discretionary trader may wait for a breakout, higher low, volume expansion, or other contextual evidence.
Daily chart or intraday chart?
The word “day” in 50-day and 200-day matters. A 50-period average on a one-hour chart is not a 50-day average. It represents 50 hourly bars. That changes the signal completely.
Crypto trades continuously, so exchanges and charting platforms aggregate daily candles according to defined session boundaries. When comparing backtests or signals, use the same exchange, bar interval, and price source. A crossover calculated from one venue can occur at a slightly different time from another because the underlying candles can differ.
For a strategic trend filter, daily or weekly data may be more appropriate. For shorter trading horizons, intraday averages can be used, but the number of signals and the impact of fees and slippage become much more important.
What should confirm a golden cross or death cross?
Confirmation should solve a specific weakness rather than simply add more indicators. If your concern is a sideways market, you might require the long-term moving average itself to slope in the direction of the signal. If your concern is a weak breakout, you might examine whether price has cleared an important range. If your concern is liquidity, you might require sufficient volume and market depth.
A useful checklist is:
Is the 200-period average rising, falling, or flat?
Is price above or below both averages?
Did the crossover happen after a long trend, or near the beginning of a new structure?
Is the market trending or ranging?
Is liquidity sufficient for the position size?
Where is the invalidation point if the signal fails?
The last question is crucial. A crossover tells you about trend alignment; it does not tell you how much capital to risk.
Risk management matters more in crypto than the signal label
The U.S. Commodity Futures Trading Commission warns that virtual currencies can be more volatile than traditional fiat currencies and that leverage can amplify both gains and losses. Its customer advisory on virtual-currency trading risks is a useful reminder that a technically valid signal does not remove market or leverage risk.
For a crossover strategy, risk controls can include position sizing, an exit rule independent of the opposite crossover, maximum portfolio exposure, and limits on leverage. Waiting for a death cross to exit a leveraged long position after a sudden crypto selloff can be far too slow for the risk being taken.
Which crossover approach fits which need?
Need
Approach worth testing
Main compromise
Long-term trend filter
50/200 SMA on daily data
Slow entries and exits
Faster swing-trend detection
Shorter EMA pair
More whipsaws
Reduce choppy-market signals
Longer averages plus trend-slope filter
Fewer opportunities and more lag
Simple systematic rules
Close-based crossover with fixed execution rules
Little discretion to avoid obvious bad setups
Discretionary confirmation
Crossover plus market structure or liquidity checks
Harder to backtest consistently
How to evaluate a crossover before trading it
Do not judge a rule from a few famous Bitcoin charts. Define the rule precisely and test it on the exact market and timeframe you plan to trade. At minimum, record the moving-average type, lengths, source price, bar interval, entry timing, exit logic, fees, slippage, and position-sizing method.
Then evaluate more than the percentage of winning trades. Useful measurements include total return, maximum drawdown, number of trades, average win versus average loss, turnover, and performance across trending and sideways periods. A system that looks excellent before fees may deteriorate if a faster crossover trades frequently.
Also separate research from optimization. If you test dozens of MA combinations and keep only the best historical result, you increase the risk that the chosen settings fit noise rather than a durable pattern. Out-of-sample testing and multiple market regimes are more informative than a single optimized backtest.
Bottom line: use the cross as a trend tool, not a prophecy
A golden cross is best understood as delayed evidence that shorter-term price behavior has become stronger than a longer-term average. A death cross is delayed evidence of the opposite. Their value comes from imposing a consistent trend framework, not from predicting an exact top or bottom.
If you want a slow, easy-to-audit regime filter, a 50/200 SMA crossover is a sensible benchmark to test. If you need faster response, EMA-based or shorter-period crossovers may fit better, with the explicit cost of additional noise. If you trade range-bound markets, a pure crossover system may be a poor match unless you add a filter designed specifically to detect trend conditions.
The most useful question is therefore not “Is the golden cross bullish?” or “Is the death cross bearish?” Those labels are already built into the definitions. The better question is: Does this crossover’s speed, lag, trading frequency, and failure mode fit the market, timeframe, and risk budget you actually use?