Home
» News
»
Open Interest (OI) Analysis: How to Read Bullish and Bearish Leverage Without Overreading the Signal
Open Interest (OI) Analysis: How to Read Bullish and Bearish Leverage Without Overreading the Signal
Open interest (OI) is one of the most useful derivatives metrics for understanding how much positioning is still active in a market, but it is also easy to misuse. The goal of good OI analysis is not to label every increase as bullish or every decrease as bearish. It is to determine whether leverage is building, whether that leverage is supporting the current price move, and whether the market is becoming more fragile.
The clearest definition comes from regulated futures markets. The U.S. Commodity Futures Trading Commission defines open interest as the total number of futures contracts in a market that have been entered into but not yet liquidated through an offsetting transaction or fulfilled by delivery. CME Group similarly notes that each open transaction has both a buyer and a seller, but only one side is counted when calculating OI. See the CFTC futures glossary and CME Group's explanation of volume and open interest.
Open interest is best treated as a positioning and leverage measure. Price direction, funding, volume, and liquidation behavior are needed to judge whether that leverage is constructive, crowded, or being unwound.
What should you be able to conclude from OI?
A useful OI reading should answer three practical questions. First, is positioning expanding or contracting? Second, is the price move being accompanied by new risk-taking or by position closure? Third, is leverage becoming one-sided enough that liquidation risk may matter more than trend confirmation?
If your analysis cannot answer those questions, the OI number by itself has not given you enough information. OI does not tell you whether “more longs than shorts” exist in the market. Every derivatives contract has a long side and a short side. What changes is who is initiating, how positions are being opened or closed, where leverage is concentrated, and how aggressively one side is paying to maintain exposure.
How does OI differ from trading volume?
Volume measures how many contracts traded during a period. Open interest measures how many contracts remain open. A market can have heavy volume while OI barely changes if positions are frequently transferred or closed and reopened. Conversely, OI can rise steadily even without an exceptional volume spike if participants continue adding new positions.
CME Group explicitly distinguishes these concepts: volume counts contracts traded, while open interest reflects contracts that remain outstanding. That distinction matters because a high-volume move can be a short-lived burst of activity, while sustained OI growth shows that more outstanding exposure remains in the market.
When is rising OI genuinely bullish?
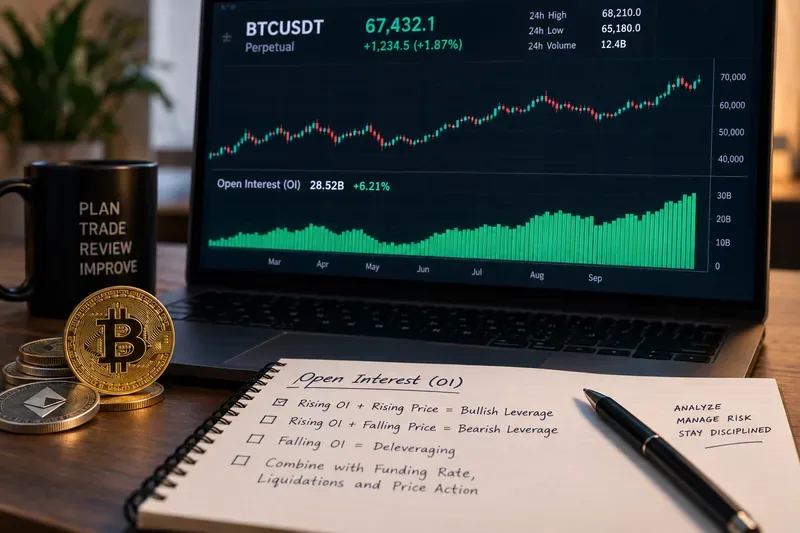
Rising OI alongside a rising price is often described as bullish leverage. The logic is straightforward: price is advancing while the amount of open derivatives exposure is also expanding. CME Group notes that increasing open interest is commonly used as confirmation of a trend because new positions are entering while price continues in the same direction.
That is a useful starting point, not a complete conclusion. A higher-quality bullish reading usually has several confirming characteristics:
Price is making sustained higher highs or holding a breakout rather than producing only a brief spike.
OI rises gradually or proportionally with the move instead of exploding vertically in a short interval.
Spot-market activity also supports the move rather than derivatives prices moving far ahead of spot.
Funding is positive but not unusually expensive relative to its recent range.
Pullbacks do not immediately trigger a large collapse in OI.
Why do these details matter? Because rising price plus rising OI can also describe a crowded market. New longs may be chasing price at increasingly poor entry levels while sophisticated participants take the other side. OI confirms that new exposure exists; it does not reveal whether that exposure will be profitable.
When does rising OI point to bearish leverage?
When price falls while OI rises, new positions are being added during a decline. Traders often call this bearish leverage because fresh derivatives exposure is accumulating as the market moves lower.
A stronger bearish interpretation usually appears when the decline is sustained, spot selling is visible, rebounds are weak, and funding becomes less positive or turns negative. In perpetual futures, funding payments help keep contract prices aligned with spot. Binance describes funding as periodic payments between long and short holders, while Coinbase notes that positive funding generally means longs pay shorts and negative funding generally means shorts pay longs, although exact formulas and intervals vary by venue. Current exchange rules should therefore be checked before comparing raw funding numbers across platforms. See Binance's funding-rate documentation and Coinbase Institutional's perpetual-futures primer.
One warning is important: price down plus OI up does not prove that shorts are “winning.” New longs may also be entering against the decline. The combination tells you that leverage is expanding into weakness. Directional confidence improves only after you compare funding, price structure, volume, basis, and liquidation behavior.
What does falling OI tell you?
Falling OI means outstanding positions are being reduced. This is usually best described as deleveraging rather than automatically bullish or bearish.
Price behavior
OI behavior
Useful first interpretation
What to verify next
Price rises
OI rises
Leverage expanding with an uptrend
Funding, spot confirmation, breakout quality
Price falls
OI rises
Leverage expanding into a downtrend
Funding, spot selling, rebound strength
Price rises
OI falls
Positions closing during an advance; possible short covering or broader deleveraging
Volume, liquidation data, whether OI stabilizes
Price falls
OI falls
Positions closing during a decline; possible long liquidation or risk reduction
The two falling-OI cases are especially easy to misread. Price up with falling OI may be a healthy reset after shorts close, but it can also indicate that an uptrend lacks fresh participation. Price down with falling OI may reflect forced long liquidation, but once leverage has been flushed out, the market can become less vulnerable to another immediate liquidation cascade.
How should funding rates change your OI interpretation?
Funding gives context about which side of a perpetual-futures market is paying to maintain exposure. Positive funding generally indicates that long positions are paying short positions; negative funding generally reverses that relationship. But funding mechanisms vary by exchange, and intervals can change. Binance, for example, updated funding documentation in March 2026 and has also announced contract-specific interval adjustments during 2026. That is why comparing a raw “0.01%” rate across venues without checking the settlement interval can be misleading.
The highest-quality use of funding is relative rather than absolute. Compare the current rate with the same contract's recent history and with nearby venues using equivalent time normalization.
Rising price + rising OI + moderately positive funding: leverage supports the trend, but watch whether funding becomes progressively more expensive.
Rising price + rising OI + extremely positive funding: bullish positioning may be crowded and vulnerable to a long squeeze if price stalls.
Falling price + rising OI + increasingly negative funding: short leverage is building; if price refuses to fall further, squeeze risk can increase.
Rapidly normalizing funding + falling OI: leverage is being removed, which often reduces immediate crowding risk even if direction remains unclear.
What does a liquidation-driven move look like?
A liquidation-driven move often produces a sharp price change and a sudden drop in OI. That combination is different from a price move accompanied by increasing OI, because positions are disappearing rather than being added.
Suppose BTC drops quickly while OI falls sharply. One plausible interpretation is that leveraged longs are being closed voluntarily or forcibly. If the drop in OI is unusually large relative to the price move, the market may be undergoing a leverage reset. The next question is not “is this automatically a bottom?” but whether selling continues after the leverage has already been removed.
The same logic works in reverse for a rapid price increase with falling OI: shorts may be closing or being liquidated. If price keeps rising after OI stabilizes and begins rebuilding, the move has stronger evidence of fresh participation than a short squeeze alone.
How do you know whether your OI analysis is working?
Judge the method by whether it improves classification, not by whether every directional forecast is correct. A useful process should help you distinguish four environments consistently: leverage building with an uptrend, leverage building with a downtrend, long-side deleveraging, and short-side deleveraging.
You can evaluate the quality of your reading with observable signs:
You can explain whether OI is rising because exposure is being added or falling because positions are being removed.
Your conclusion changes when funding, spot behavior, or liquidation evidence contradicts the first OI interpretation.
You avoid treating a single exchange's OI as the entire market when major liquidity exists elsewhere.
You normalize funding intervals before comparing venues.
You distinguish a trend supported by new positioning from a squeeze driven by position closure.
If your notes repeatedly reduce to “OI up = bullish” or “OI down = bearish,” the framework needs to be revised. That shortcut ignores the defining feature of OI: every open contract contains both a long and a short.
When should you change your approach?
Switch from simple price-plus-OI interpretation to a broader derivatives view when OI moves unusually fast, funding reaches an extreme relative to its recent history, price diverges sharply from spot-market behavior, or major exchanges show different patterns.
You should also reduce confidence when the market is reacting to a major event. During macroeconomic announcements, exchange disruptions, regulatory news, token unlocks, or sudden liquidity shocks, OI can change faster than normal relationships can be interpreted. In those conditions, position management and confirmation matter more than forcing a clean bullish or bearish label.
What are the limits of OI analysis?
Open interest is a positioning metric, not a complete sentiment indicator and not a standalone trading signal. It does not identify individual counterparties, show their entry prices, reveal their leverage ratios, or prove which side initiated a trade. Aggregated OI can also differ across exchanges because contract specifications, collateral, reporting methods, and market share differ.
OI is most useful when treated as one layer of evidence. Combine it with price structure, spot volume, funding, basis, liquidation behavior, and venue-specific market conditions. The result should be a better description of market leverage, not a promise about the next candle.
That is the practical standard for high-quality OI analysis: know whether leverage is entering or leaving, determine whether it is reinforcing or contradicting price, recognize when positioning becomes crowded, and lower confidence when the supporting data stops agreeing.