Forex Session Overlap in Local Time: The 2026 DST Shift

See how U.S. and U.K. daylight saving dates shift the London–New York forex overlap, with 2026 local-time examples and a practical conversion method.
In a volume profile, the point of control (POC) is the price row with the most recorded volume for the selected period. The value area (VA) is a chosen band of prices containing a set share of that period’s volume; 70% is a common setting, not a universal rule. Value Area High (VAH) and Value Area Low (VAL) mark the upper and lower edges of that band.
These levels summarize where activity occurred in a defined slice of market data. They do not, by themselves, show who initiated trades, establish fair value, or predict the next move. Their practical meaning depends on the profile’s time range, price-row size, data feed, and volume calculation. Before using a level as a decision reference, check those inputs and compare how price behaves around it.
Imagine a profile built for one completed trading session. The chart divides the session’s traded prices into rows and assigns volume to each row. The POC is the row with the greatest total volume. It is the profile’s single highest-volume price level, not the session’s average price, the closing price, or a guarantee that buyers and sellers agreed on a lasting “fair” price.
For example, suppose a hypothetical profile records its largest row at 100.00. That price is the POC for that profile even if the market opened at 98.00, closed at 102.00, or spent a longer time elsewhere. The POC may shift while a session is still forming as new volume is added. A completed-session POC is fixed for that completed data set, but a developing POC can move.
Some platforms group several ticks into one row. If the row size changes, the amount of volume aggregated at each price bucket changes too; the POC may move to a different row. If two rows tie, platform-specific rules can affect which one is marked. So when comparing POCs from different charting tools or settings, compare their row size and calculation method as well as their market data.
The value area is an algorithmic selection of price rows around the POC until the chosen percentage of profile volume is included. With a 70% setting and a hypothetical session total of 10,000 contracts, the target is 7,000 contracts. The algorithm begins with the POC row, then expands into neighboring rows according to their volume until the target is reached. The highest included row becomes VAH; the lowest included row becomes VAL.
That description explains the idea, but implementations can differ in their exact expansion and tie-breaking rules. TradingView documents a method that compares the next row above and below the current area, adds the larger-volume candidate, and applies tie-break rules when volumes match. Other platforms expose different inputs, such as value-area percentage and ticks per row. The result is a computed range, not a boundary discovered independently of those settings.
The 70% convention is often used, but traders can set another percentage. Raising it generally widens the band; lowering it generally narrows the band. A wider band captures more of the profile but can be less selective as a reference. A narrower band highlights a smaller central portion, but may exclude meaningful activity. Choose one setting that fits your analysis and keep it consistent when comparing periods.
| Level | What it identifies | What it does not establish |
|---|---|---|
| POC | The price row with the highest recorded profile volume | The average price, a guaranteed reversal, or buyer control |
| VAH | The highest row included in the selected value area | A guaranteed ceiling or resistance level |
| VAL | The lowest row included in the selected value area | A guaranteed floor or support level |
Traders sometimes use “value” as shorthand for the area where the market conducted a large share of its activity. That can be a useful description of a past profile, but the label does not prove that the band is objectively fair, fundamental, or likely to hold. A profile records activity over the selected window; a new session, news event, or change in liquidity can make those old levels less relevant.
Likewise, VAH and VAL are possible reference zones, not automatic support and resistance. If price approaches a previous VAH, you can observe whether it stalls, rejects, or trades and holds above the area. Those are different outcomes. A brief move through a line may be noise or a test; sustained trading beyond it may indicate the earlier distribution is no longer containing activity. Define what counts as acceptance or rejection in your own method instead of treating a touch as a signal.
Choose the profile window to match the question you are asking. A session profile is useful when you want to compare one trading session with another. A fixed-range profile focuses on a move or event you select, such as a defined rally or consolidation. A visible-range profile recalculates based on the currently displayed chart area, so zooming or scrolling can change its levels. These are different samples of activity; their POCs and value areas are not expected to match.
For a decision tied to yesterday’s session, a previous-session profile offers stable reference levels during the current session. For an evolving intraday read, a developing profile shows how the current distribution changes as activity accumulates. The trade-off is stability versus responsiveness: a developing POC can be informative in real time but is provisional, while a completed profile is stable but describes a period that has already ended.
Only to the extent that you understand the feed. A centralized futures exchange can report volume for its listed contracts; that is observed activity in those contracts, not a complete measure of every related market. Spot foreign exchange is decentralized. TradingView says its volume profile uses tick volume for forex and certain CFDs, where tick volume counts price updates rather than total currency traded. That may help describe activity in a broker or data provider’s feed, but it is not consolidated global spot-FX volume.
Some platforms also split profile volume into “up” and “down” categories. In TradingView’s documented method, bars are classified using price direction inside the lower-timeframe bars, not by identifying every buyer-initiated or seller-initiated transaction. Do not read those colors as a complete order-flow record unless the provider’s data and methodology support that interpretation.
Non-standard chart types can introduce another limitation. TradingView cautions that volume profiles on charts such as Renko or Heikin Ashi can use synthetic price bars and distorted volume allocation. If precise price-level context matters, verify the profile on a standard price chart with an appropriate underlying data feed.
Use POC, VAH, and VAL as a compact description of prior activity, then test the context that matters for your decision:
Used carefully, volume profile value area levels help describe where activity clustered and where the profile’s boundaries sit. The strongest result is a level you can reproduce from clear inputs and interpret in context. A line on a chart cannot replace checking the data source, the selected period, and what price does when it reaches the level.
See how U.S. and U.K. daylight saving dates shift the London–New York forex overlap, with 2026 local-time examples and a practical conversion method.
See how the 30-day wash-sale window, partial share matches, basis adjustments, Form 8949, broker reporting, and section 475(f) affect active traders.
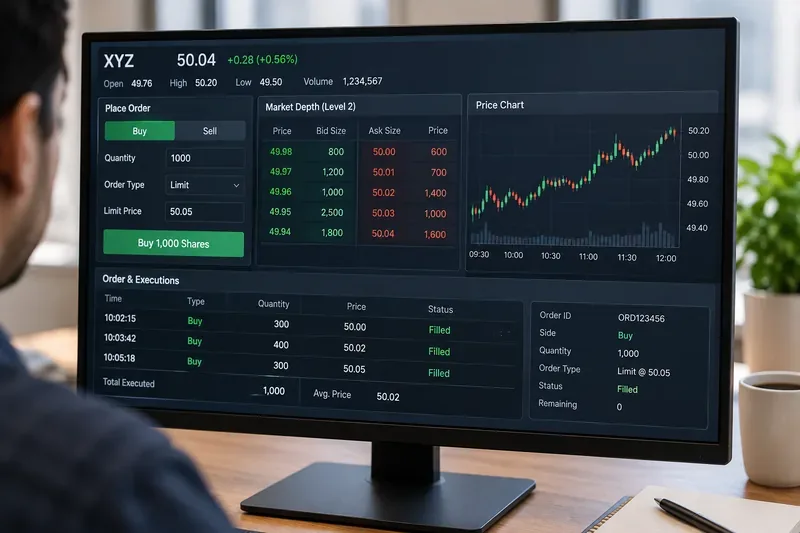
Learn why a single stock order can be partially filled at different prices and times, how liquidity and queue priority drive fills, and what to check before trading.
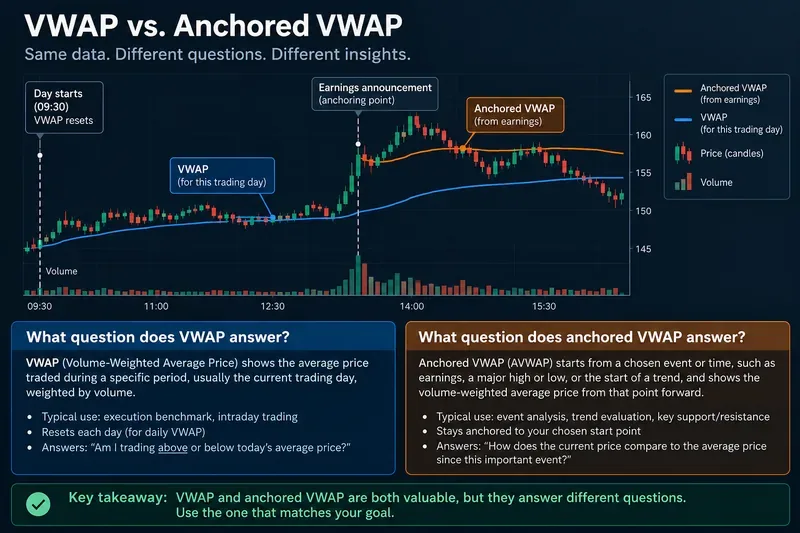
VWAP measures the volume-weighted average for a defined session; anchored VWAP starts from a chosen event. Learn when each benchmark is the better fit.
Compare market and limit orders in fast markets. Learn how fill likelihood, slippage, price limits, and queue priority affect execution—and what to check before trading.
Understand how volume profile defines the value area, VAH, VAL, and POC, what these levels can reveal, and why settings and data sources change the reading.
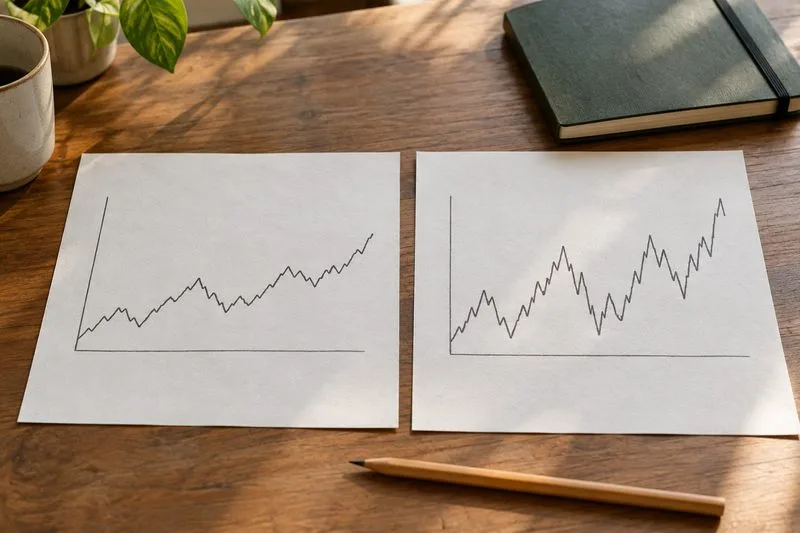
Learn how correlation and beta differ, why assets with the same correlation can have different market sensitivity, and what each measure leaves out.
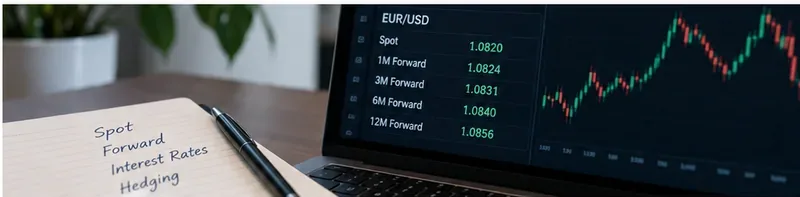
Learn what FX forward points are, how interest-rate differentials and cross-currency basis shape them, and why a forward rate is a hedge price—not a spot forecast.
Learn how to calculate currency carry trade returns by combining interest income, exchange-rate movement, rollover financing, spreads, and commissions in a worked example.
Learn how nominal and real Treasury yields differ, why real yields often matter more for gold, and how both rates affect growth stock valuations.